Author: Raidell Avello Martínez – Translation: Erika-Lucia Gonzalez-Carrion
Scientific research is based on hypothesis testing, with the essential idea of fitting a statistical model to our data and then evaluating it with a statistical test. If the probability of obtaining results by chance is less than .05, then we generally accept the experimental hypothesis as true: that is, there is an effect on the population. We usually report «there is a significant effect of However, we cannot be blinded by that term «significant» alone, because even if we find a low result of significance, this does not necessarily express that the effect was significant. Small effects sometimes produce significant results, especially when using large samples.
A non-significant result should not be interpreted as «…there are no differences between the means…» or «…there is no relationship between the variables…», because no matter how poor the difference, there is one, and this may be important for some studies despite not being statistically significant.
One measure that helps to quantify and understand the results of a hypothesis test is the size of the effect, this complements the significance. The effect size is the magnitude of the result, which allows us to provide an estimate of the scope of our findings. In statistics, effect size refers to a way of quantifying the size of the difference between two groups. It is relatively simple to calculate and understand, and can be applied to any measured outcome in the social sciences. It is especially valuable when quantifying the effectiveness of an intervention, relative to some comparison.
How great is the effect? In this sense it is important to contextualize the size of the effect according to some reference, for example, previous scientific results. Furthermore, they should not be arbitrary, but should come from the very scale of measurement we are working with. There are 3 strategies that can help in the correct interpretation of effect size, called the three Cs:
- the context,
- the contribution
- Cohen’s criteria
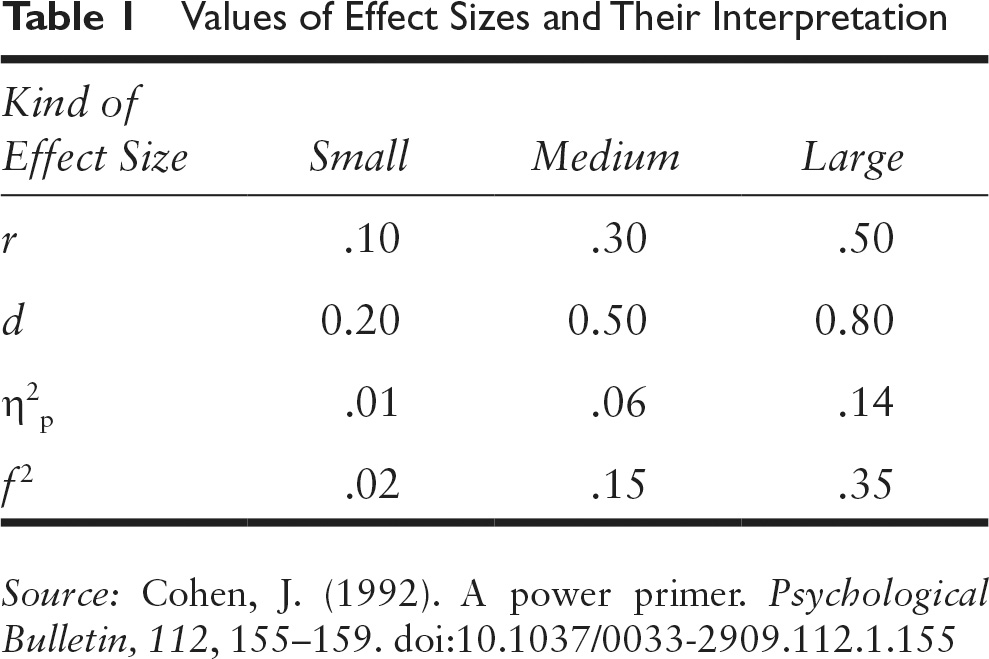
Depending on the context, a small effect can be significant, for example: if it triggers large consequences or responses, if small effects can accumulate and produce large effects, among others. The other element is to evaluate its contribution to knowledge, that is, if the observed effect differs from what other researchers have found and if so, in how much; for this it is necessary to compare the existing literature with our results and provide alternative explanations for our findings. Finally, Cohen’s criterion should be taken into account, which establishes 3 cut-off points for interpreting the size of the effect according to the values of the statistician, specifically for Cohen’s «d». However, these cuts depend on the statistic used, so it is necessary to consult the specificities of each effect size meter to make its interpretation, which in most cases is used: small effect, medium effect, large effect, as we can see in the following table:

In this regard, the APA v7 style manual (American Psychological Association Publication Manual 7th Edition) proposes to conform to the JARS standards (Quantitative Design Reporting Standards, JARS, https://apastyle.apa.org/jars/), where it is specified that the «estimated effect size and confidence intervals of each inference test performed» should be reported whenever possible. In fact, APA researchers have identified that not reporting the effect size is one of the 7 most common failures in scientific articles.
That is why leading academic journals do not admit quantitative research articles that do not report effect size. This has become one of the invariant data when reporting research that involves comparison tests between groups and associations. For this reason, Comunicar demands this measure in its articles of this cut, for example, in one of the last issues it was reported:

In which evidence of correct use of effect size and adequate reporting.
There are several families (or types) of effect size measures related to the types of tests performed, and each of these measures has a different interpretation depending on its values. Among the main ones are:
- Correlations: effect size based on the variance explained (e.g., Pearson’s r, coefficient of determination R2, Cramer’s V, and eta-squared η2).
- Differences: effect size based on differences between groups (e.g. Cohen’s d, Glass’ Δ, Hedges’ g, Odds ratio and Relative risk).
Finally, there are 3 important reasons to report on effect size:
- The p-value can tell you the direction of an effect, but only the estimate of the effect size will tell you how large it is.
- Without an effect size estimate, no meaningful interpretation can take place.
- It allows you to quantitatively compare the results of studies conducted in different situations.
